Charting platform
In this article will discover how choosing the right charting platform to view price and carry out analysis is critical to your success.
Nowadays, trading platforms are everywhere, so knowing which has the right features and which to choose for trading isn’t as easy as it seems. However, in the past few years, one platform has climbed to the top. I’m talking about TradingView, ring a bell?
Combining highly advanced charts with a whole suite of social features, TradingView has cemented itself as one of the top Stocks, Futures, Crypto, Indices, Forex charting platforms.
It’s easy to use, packed with amazing features not found on most other platforms, and best of all, completely FREE.
Today I’m going to give you a complete walk-through of how to use TradingView along with its many features.
I’ve used TradingView for 3 years. I made the switch from Zerodha’s Trading view back in 2020. So I know the tips, tricks, and little secrets that will help you to get started.
TradingView has updated layout of menu as of 04 Aug 2023. But not much has changed that the following article needs to be updated.
How to sign up to get 30$ credit and create a FREE TradingView account.
- On this site footer (Bottom) there is a link called TradingView under Trading Platforms and above social media links. Also you can click here.
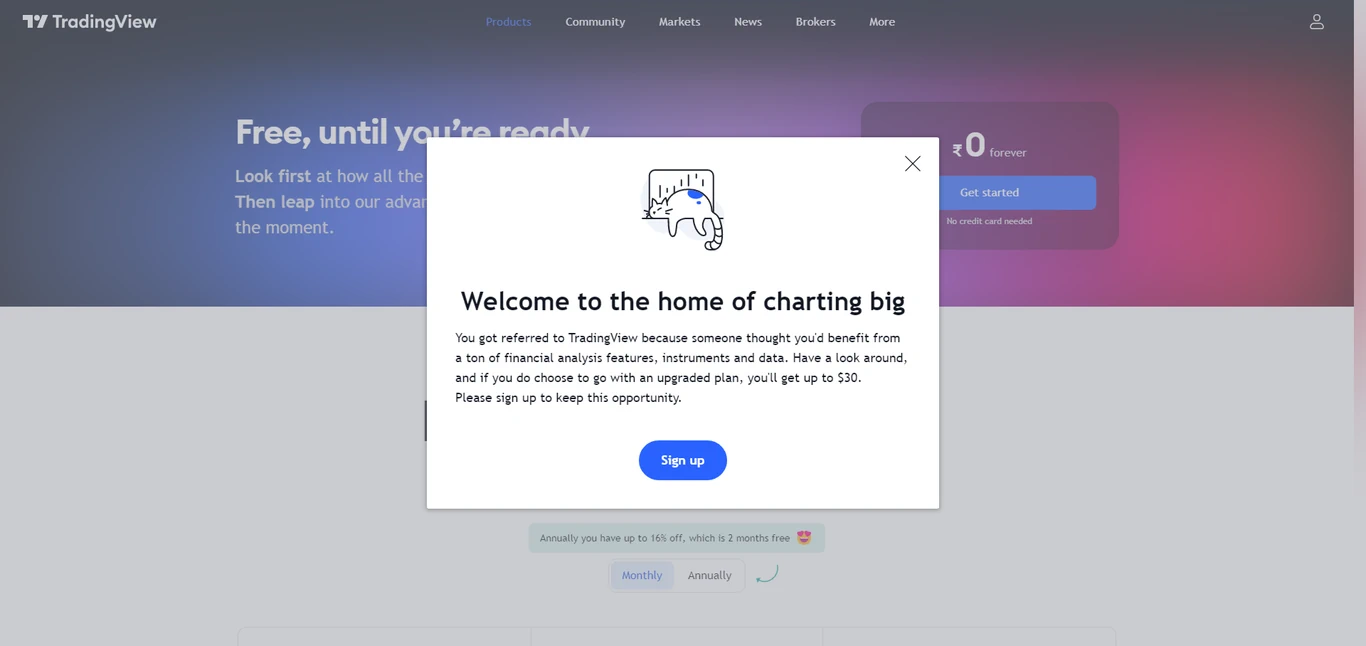
- Clicking on it will take you to TradingView site and give you a welcome banner & click on the signup button of welcome banner will take you to signup page.
- Enter your details either through social media like google, Facebook etc. We personally recommend through Email as privacy is our concern.
- After clicking Email enter you info such as preferred username, email and password.
- Click on create account. voila your TradingView account is created and you get 30$ to use in the future if you need extra features.
- Needless to say for new trader/user FREE TradingView is more than enough.

Overview of all the tools & TradingView Layout.

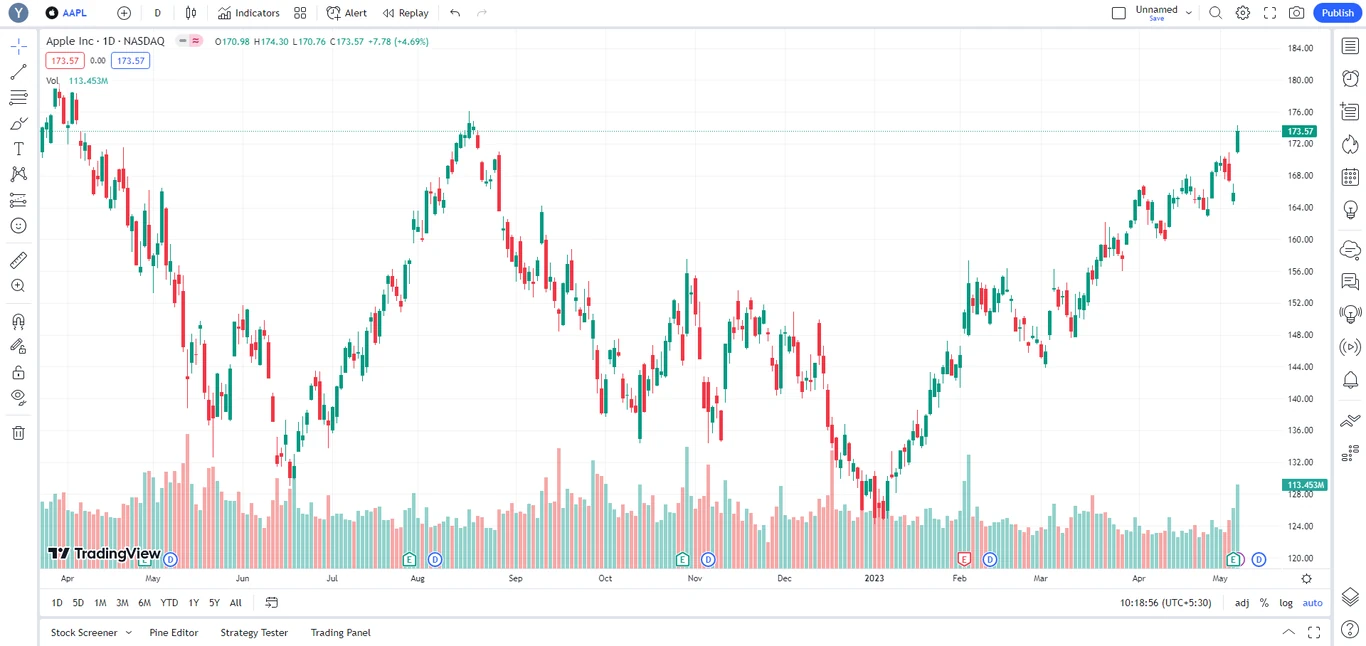
The above image is how a new account of TradingView looks. Lets look at the layout of this charting platform.

As you can see in the above image. There are 5 Key areas on chart as follows:
- Center – Chart. (Blue Color)
- Top Menu/Panel- Symbol Search, Timeframe, Indicators etc. (Red Color)
- Left Menu/Panel – Drawing Tools. (Green Color)
- Right Menu/Panel – Watchlist, Order Panel, DOM. (Yellow)
- Bottom Menu/Panel – Stock Screener, Trading Panel etc. (White Color)
Lets explorer all the 5 areas. Will only detail what tools are needed for analysis whereas you are free to explorer the platform.
1. Center – Chart.
This is self explanatory whatever chart you want is displayed here. Candlestick chart is main go-to chart and for RSI Divergence or generalize idea of market direction we use Line chart.
Other charts which are available in TradingView are Bars, Hollow Candles, Columns, Area, High-Low, Heikin Ashi, Renko, Line Break, Kagi, Point & Figure, Range etc. Chart can be zoomed in and out with mouse scroll and also with dragging the price scale up/down to zoom vertical and dragging the time scale right/left to zoom horizontal. To reset chart press Alt+R or right click > Reset Chart.
2. Top Menu/Panel – Search, Timeframe, Indicators etc.

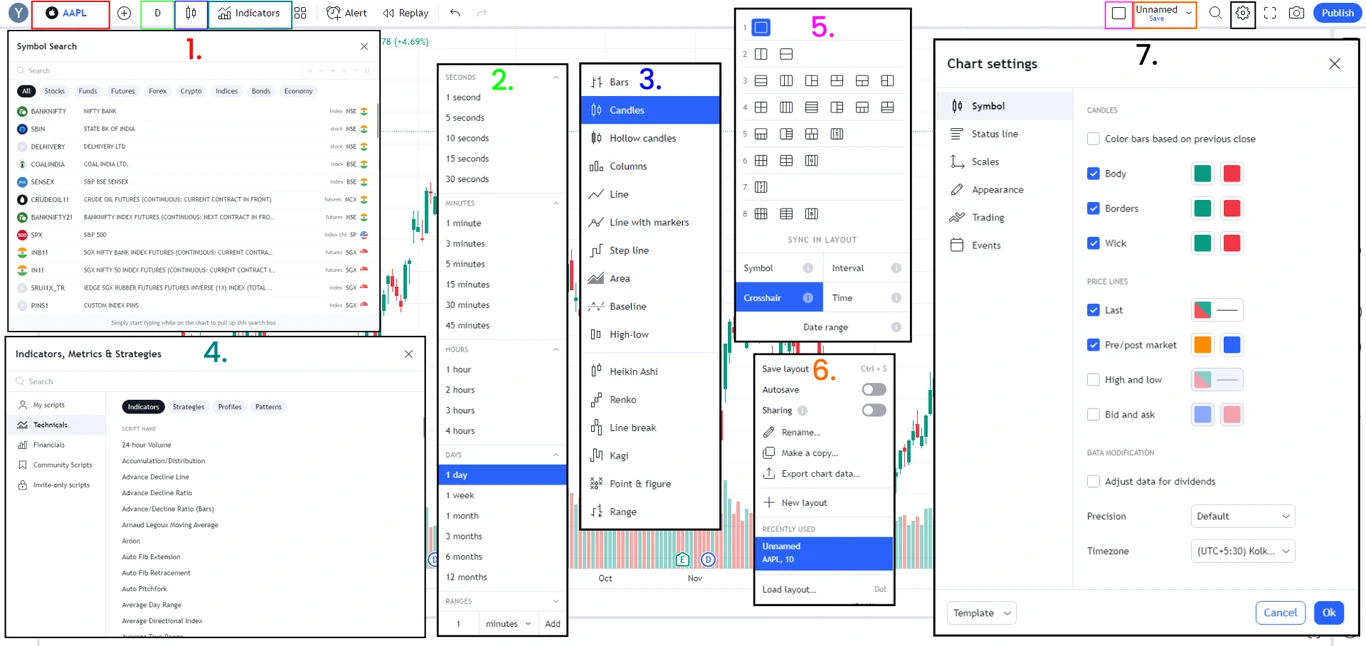
The above image shows Top menu option in rectangle colored which when clicked displays panels as shown in respective colored numbers. Lets go through each one.
- Symbol Search – In the top left (red border) shows the current instrument AAPL when clicked opens a dialogue in the image no. 1 in red color. Here you can search any script by name in the search. TradingView offers Stocks, Funds, Futures, Forex, Crypto, Indices, Bonds and Economy.
TradingView offers exchange data Free (Sometimes delayed check before trading) as well as Paid through add-on. - Timeframe – In the top left (green border) shows the current chart timeframe. TradingView offers 1m, 3m, 5m, 15m, 30m, 45m, 1H, 2H, 3H, 4H, 1D, 1W, 1M and 3,6,12M for Free. For Paid Plan you add custom timeframe like 10m or 2m etc. as well as seconds timeframe also get unlocked.
- Chart Type – In the top left (blue border) shows the current chart type i.e.. candlestick in the image. Bars, Candle, Hollow Candles, Columns, Line, Line with markers, Step line, Area, Baseline, High-Low, Heikin Ashi, Renko, Line Break, Kagi, Point & Figure and Range are available on TradingView.
- Indicators, Metrics & Strategies – After chart type to the right of it is Indicators (teal border). In the you can find all the Free indicators in the Technicals some of the most popular ones are moving average, MACD, RSI etc. In the Profiles tab contains Volume Profile which you only get with Monthly Paid Subscription.
If you want Volume Profile for Lifetime on TradingView then no need to look elsewhere we offer custom built Volume Profile with S/R Zones and VWAP tools Click Here to Know More. - Select Layout – In the top right (Fuchsia color aka pinkish) is Layouts button clicking it gives the menu no. 5 in the image. You can see in that menu single layout is one. 2nd one is double layout Left/Right or Up/Down charts etc. till 8th one is with 8 charts in one single screen.
Plus in the bottom you can sync Symbol, Interval (Timeframe), Crosshair and time of multiple layouts. Single Layout is Free other are available in Paid. - Save Layouts – In the top right (orange color) gives the menu no. 6 in the image. Whatever layout you create single, double or eight layouts here you can save it also saves drawing from the chart and auto save.
There is also an option to export chart data like OHLC and volume to csv format to view in other chart platforms or in excel sheet to develop offline strategies. - Chart Settings – Here you can set how the chart info is displayed to you. As you can see in the image menu no. 7 settings available are Symbol, Status line, Scales, Appearance, Trading, Events. Will Discus what settings are best in next article.
3. Left Menu/Panel – Drawing Tools.

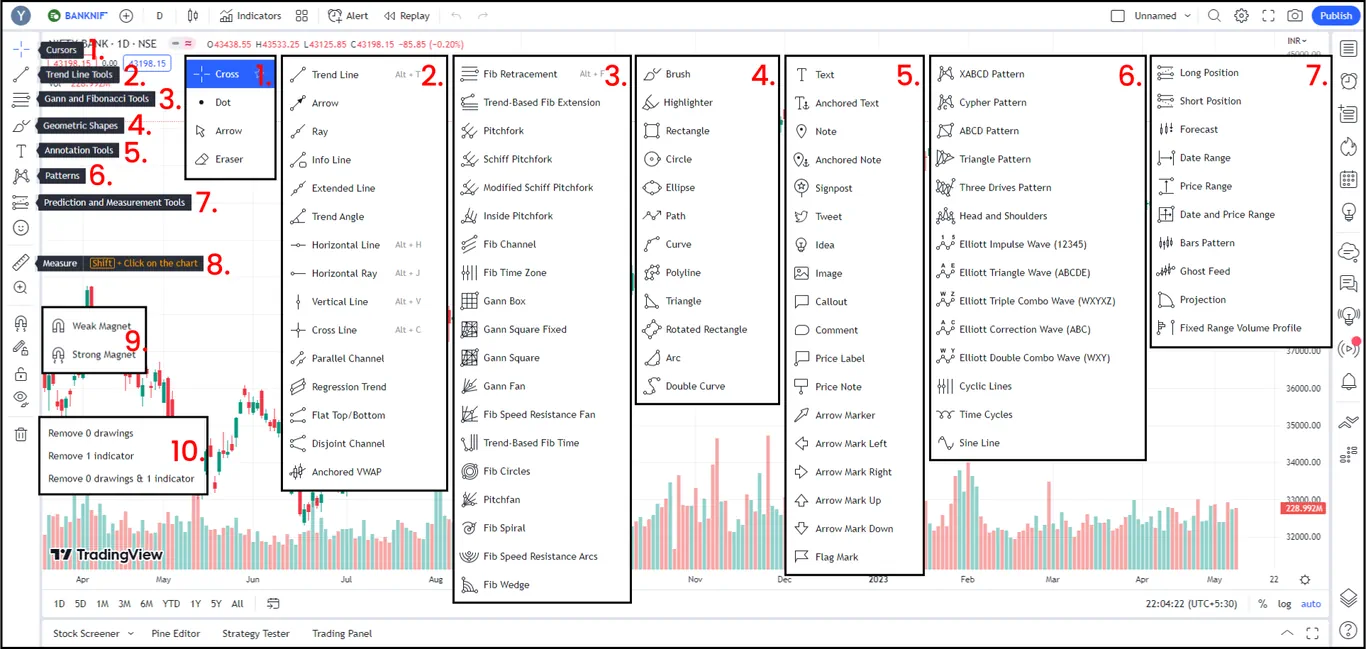
The above image shows Left panel menu option which is dedicated to Drawing tools when clicked displays panels as shown in the image 1-7 and 9, 10 respective. Will later teach some of the tools which we gonna learn in our course. Lets go through each one.
- Cursors – Type of cursor you want displayed in charts, available are Cross, Dot, Arrow and Eraser to delete the drawings drawn on chart.
- Trend Line Tools – This panel is dedicated to trendlines. The important ones are Horizontal Line & Ray, Vertical Line.
- Gann and Fibonacci Tools – This panel contains variety of tools from Fibonacci and Gann. We only use Fib Retracement. You can explore many of them but personally we don’t find their use for profitable trading.
- Geometric Shapes – This ones contains all geometric shapes. From this we use Brush, Rectangle and Path.
- Annotation Tools – These ones exist to draw notes on chart. Usefully for Analysis, Teaching, and record keeping etc.
- Patterns – These are the patterns you draw on chart to determine the target according to patterns. Check our eBooks which has poster of Chart Patterns dictated with Price Action.
- Prediction and Measurement Tools – All the Risk Reward tools, Target and stoploss measurements are located here also Forecast and projection.
- Measure – Quickly measure with ruler on chart.
- Magnets – Snaps drawings to OHLC points with precision instead of manual drawing. Available option are Weak and Strong Magnet.
- Delete – This deletes the drawings as well as indicators and available options are Remove drawings, Indicator or Remove both.
4. Right Menu/Panel – Watchlist, Order Panel, DOM.

The above image shows Right panel menu option when clicked displays panels as shown in the image 1-5. As you can notice many option that we didn’t cover because they are not important but you may explorer yourself. Lets go through each one.
- Watchlist, Details and News – Watchlist is a place where you save a list of instruments (Scripts) to switch your chart quickly just like how you favorite your music playlist to go through your songs instead of searching it.
In the image no. 1 you can see watchlist and below watchlist you can see the details of the current selected chart i.e. State bank of India. Some of the imp details of a script you can view quickly are Bid x Ask, Price ranges, Latest News, Key Stats, Earnings, Dividends, Performance and Profile. - Alerts – You can place alerts to price or indicator when a condition is met which helps you relaxed and only get into action when needed. For Free account you get 1 Price Alert and 1 Indicator Alert to place. If you want more alerts then upgrade your TradingView plan. Use the 30$ you got when you signed up through our link if not Click here.
- Calendar – Calendar is a place where you get Economic Calendar of your select countries which markets you trade and also get Earnings Calendar below the Economic Calendar. No need to leave the charting platform.
- Order Panel – In this panel you can place orders for current script on chart i.e. in image you can see selected market is NSE:SBI and connected broker is Dhan. You can place Buy or Sell orders from here. Will explorer about orders in dedicated article.
- DOM – In this panel you can see Depth of Market here you can see the how the price discovery is happening.
5. Bottom Menu/Panel – Stock Screener, Trading Panel etc.
Now on the bottom there are 4 tabs they are Stock Screener, Pine Editor, Strategy Tester and Trading Panel.

The above image shows Stock Screener will see the use of screener in later articles but in short it is used to filter stocks according to your criteria.

The second tab is Pine Editor which is the most popular feature of TradingView i.e. you can create your own Indicators and Strategy and you can publish it as an open source public, Private or Invite only. Pine Scripts are basically TradingView’s custom version of Python Language. So if you know python you can create your own custom indicators scripts and if you don’t know python you can still learn pine script from the documentation.

The third tab is Strategy Tester here you can get the strategy data of historical test of how you strategy performed i.e. Profits and losses so that you can decide weather you need to tweak your strategy or not.

The last one is Trading Panel here you connect to your broker so that you can trade from TradingView itself. The below image shows Paper trading which is dummy trading for new trader to test their trading skills so that no huge losses are made in the beginning

You can also connect to Dhan broker for Indian market. First Indian broker to be integrated to TradingView Platform. Below is the image of Dhan connected to TradingView.

If you don’t have Dhan broker Account then click here to open the account Free. That’s it for TradingView Platform. If you use any different charting Platform then the basic Functionality you learned here will be mostly same. In next article will see what settings to keep for TradingView’s Charting Platform.