
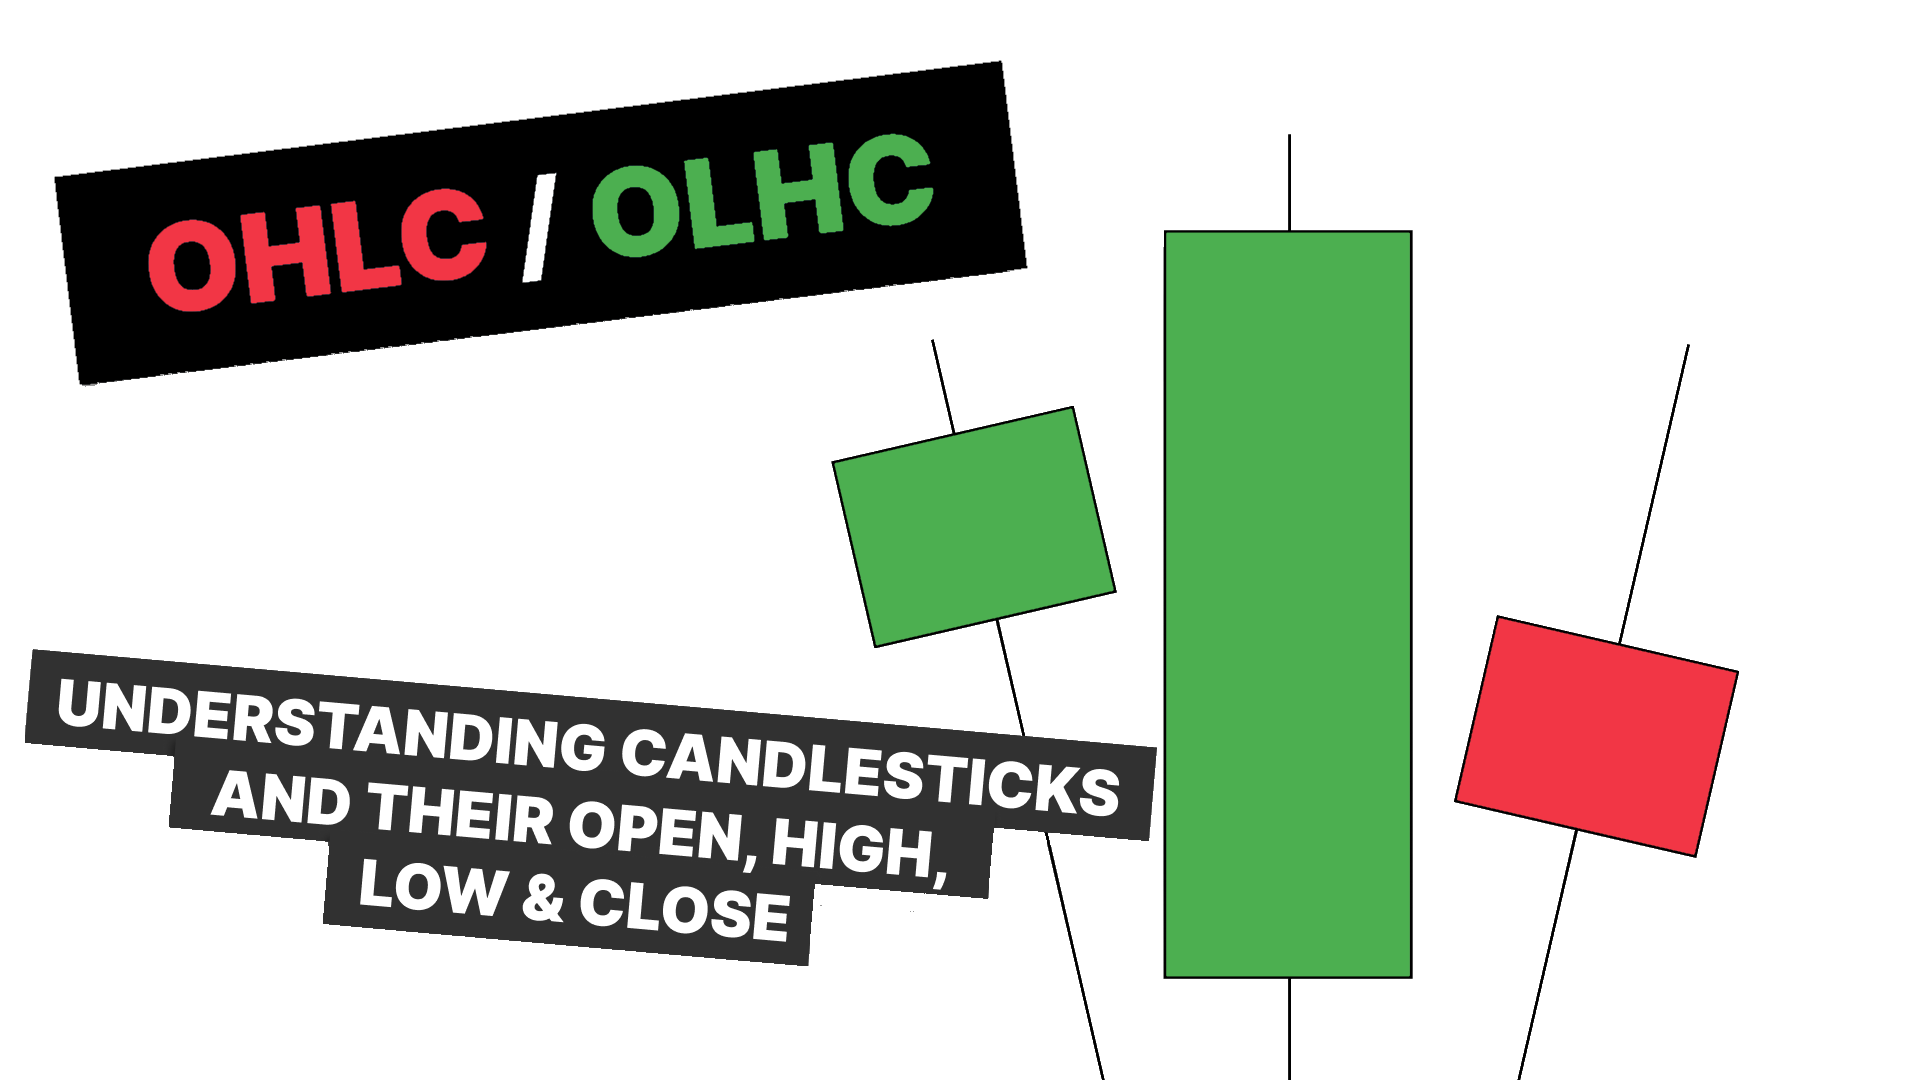
Understanding Candles: Open, High, Low, Close
August 10, 2025
Every candle tells a story. This guide breaks down OHLC, explains bullish vs. bearish structure, and shows how to spot directional, reversal, and indecision candles for cleaner entries.
Introduction
In this post, we’re breaking down one of the most fundamental parts of trading: the open, high, low, and close of candles (OHLC). Every candle on every timeframe tells a story. By understanding what it’s showing you, you can better anticipate direction, identify reversals, and recognize consolidation in the market.
Defining bullish and bearish candles
Every candle has four points:
- Open – where price starts for that time period
- High – the highest price reached
- Low – the lowest price reached
- Close – where price ends for that time period
If the close is below the open, that’s a bearish candle.
If the close is above the open, that’s a bullish candle.
This structure is the foundation of trading. From here, you can see how higher-timeframe candles are built from lower-timeframe movement and start grouping candles into the three main types.

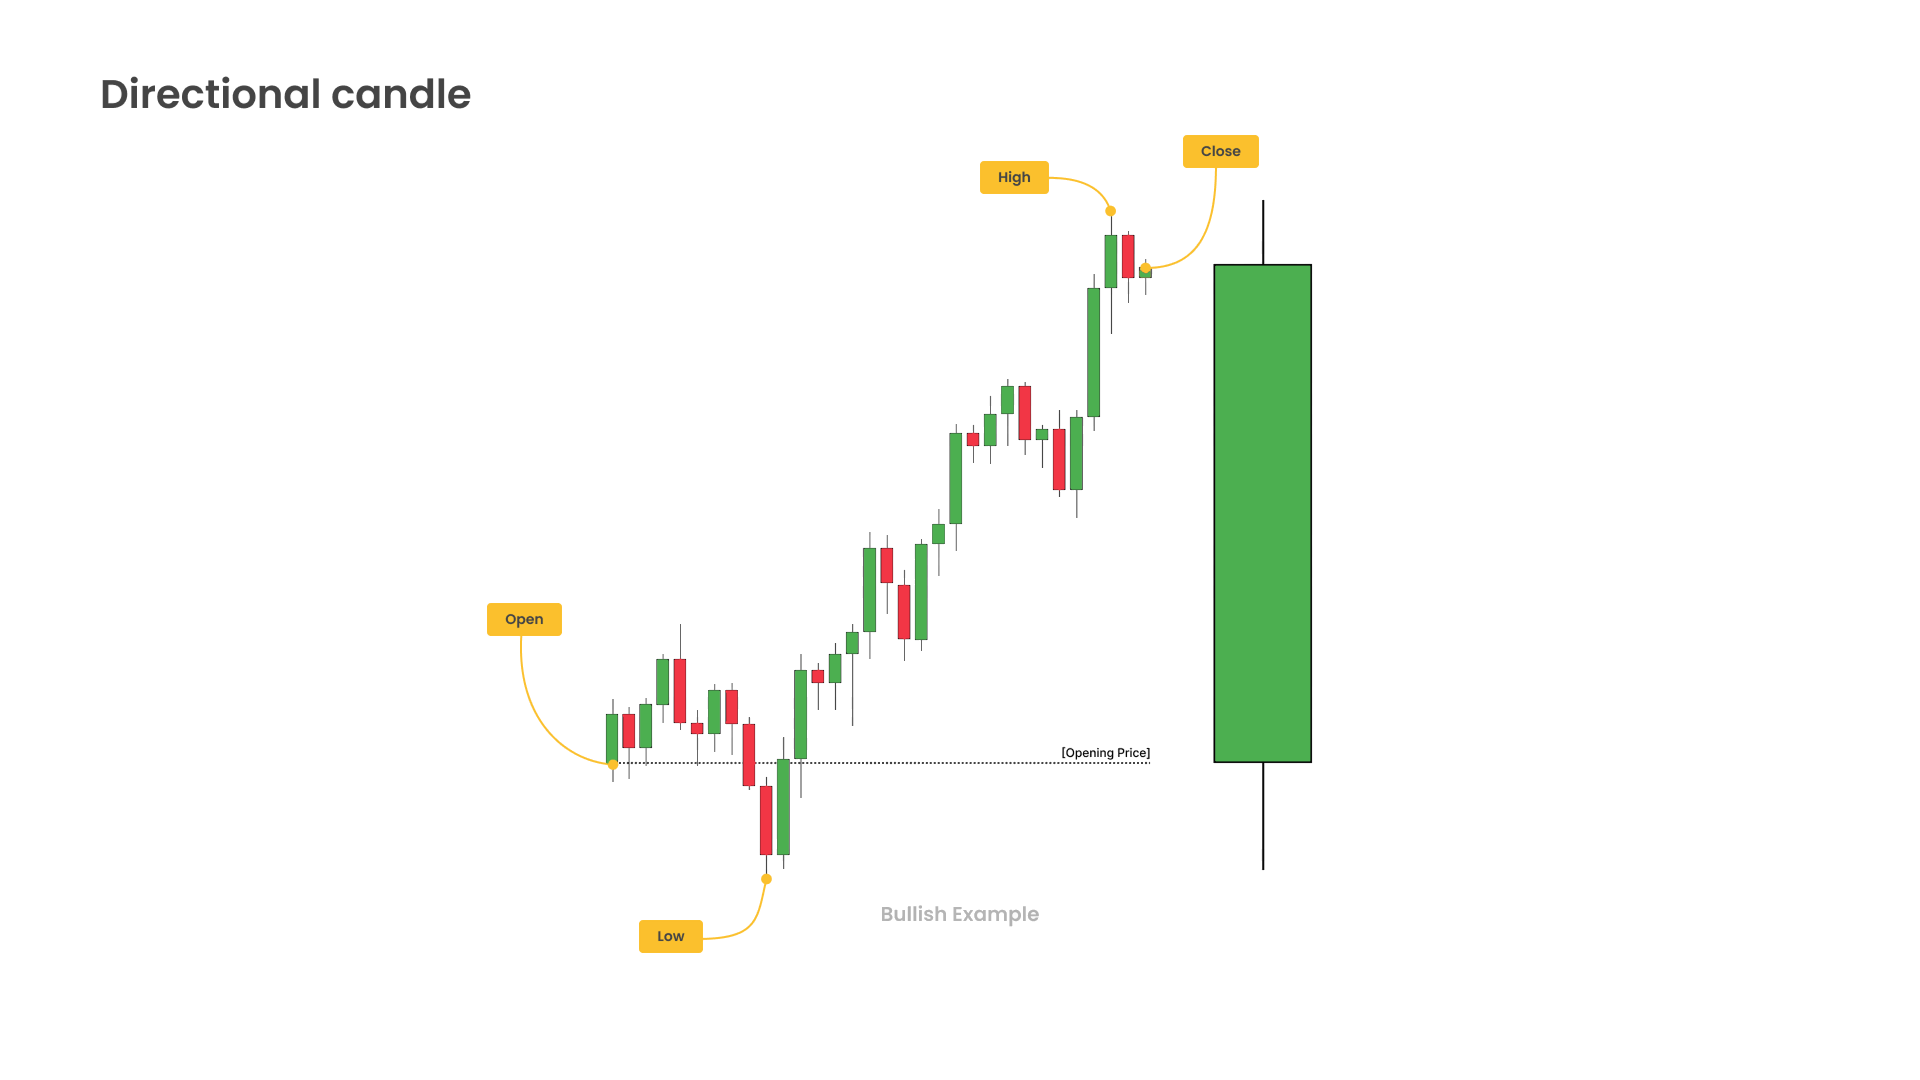
Directional candles
A directional candle moves mostly one direction throughout the time period.
- Bullish directional: price opens, dips a bit to form the low, trends upward most of the period, and closes near the high.
- Bearish directional: price opens, pushes above the open to form the upper wick, trends down most of the period, and closes near the low.
The tell: the wick is relatively small compared to the body, signaling a strong, one-sided move. On lower timeframes, you’ll usually see steady continuation in the same direction.
Tip: 💡
Focus on expansion candles that have a small wick. Small wicks are the key to understanding which candles support expansion.
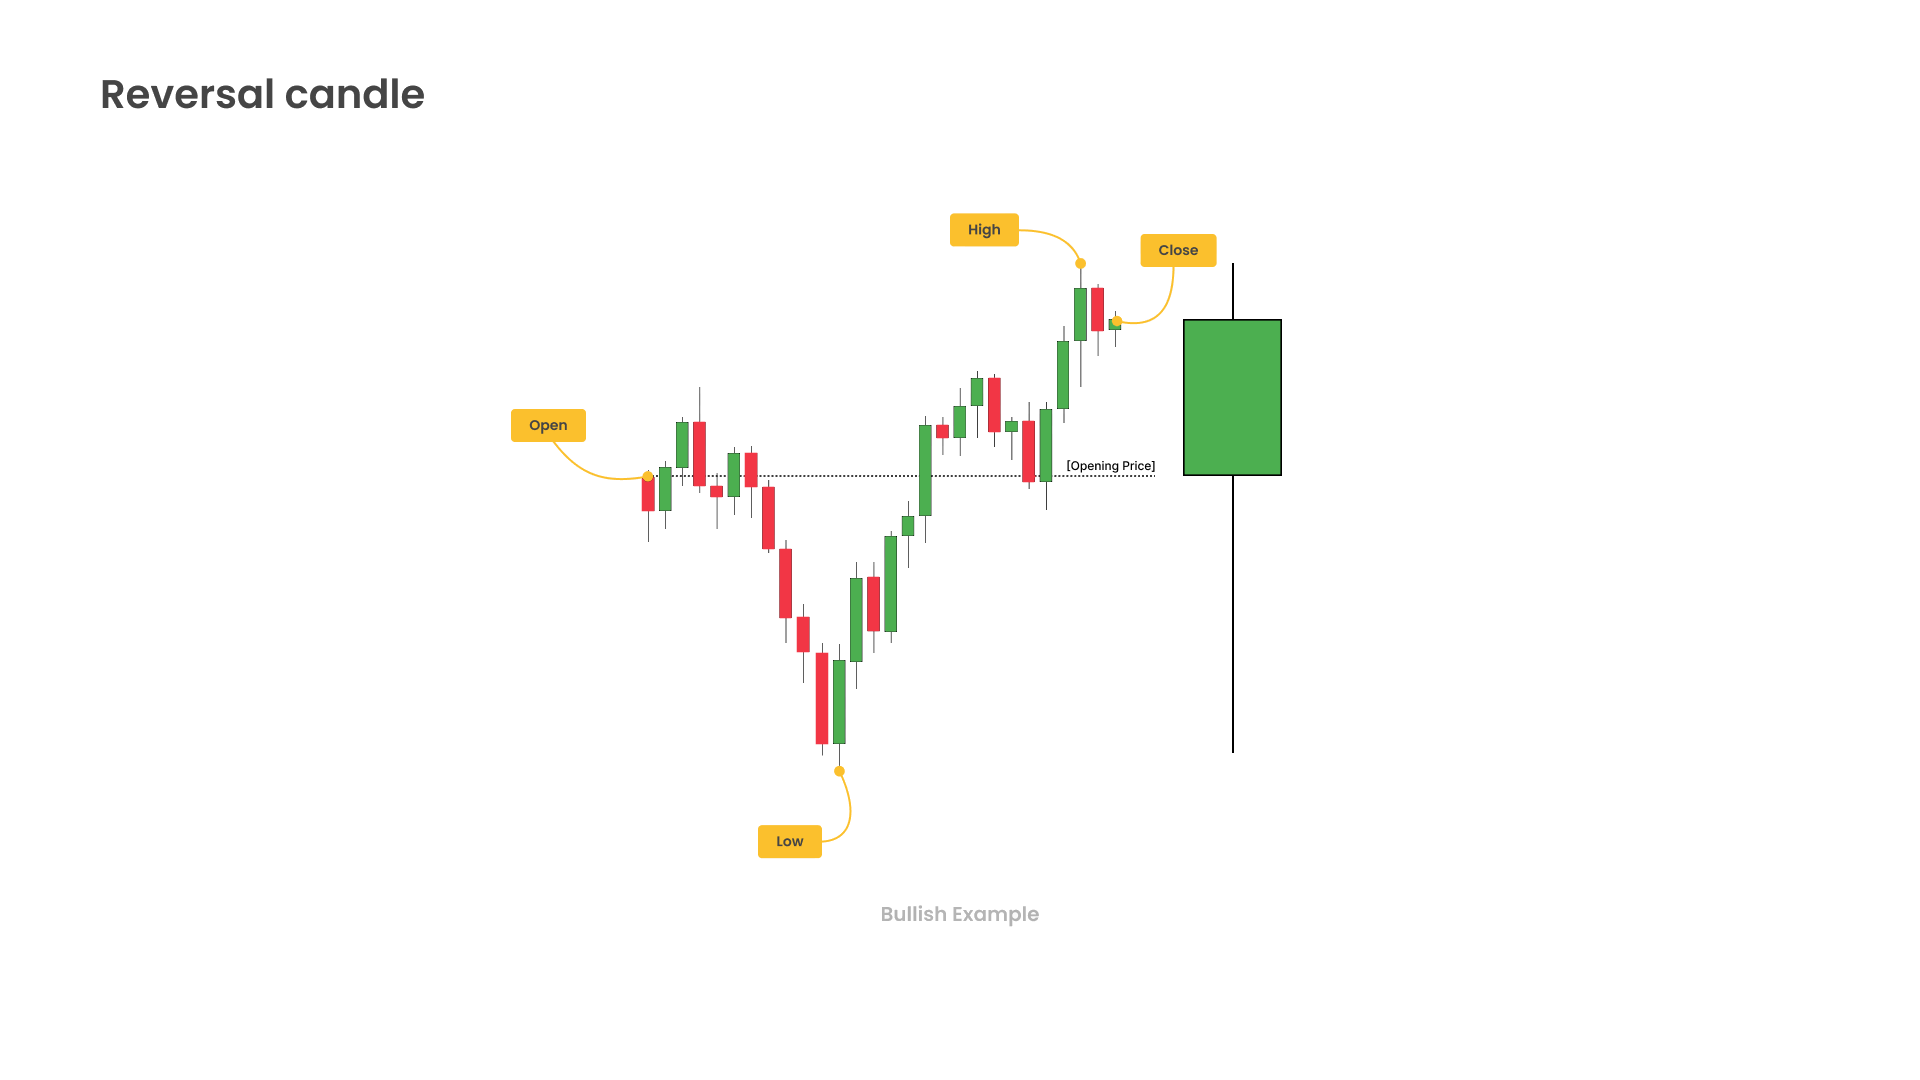
Reversal candles
Reversal candles show a shift in control within the same period. The wicks are typically larger than the body.
- Bearish reversal: price opens, pushes higher as if continuing up, then flips and closes lower.
- Bullish reversal: price opens, dips lower as if continuing down, then flips and closes higher.
On lower timeframes, it looks like a trend attempt that fails and snaps back. Seeing these at key levels can be an early cue that a larger turn is forming.
Tip: 💡
If trading a reversal candle, focus on targeting: Opening price, current candles high or low.
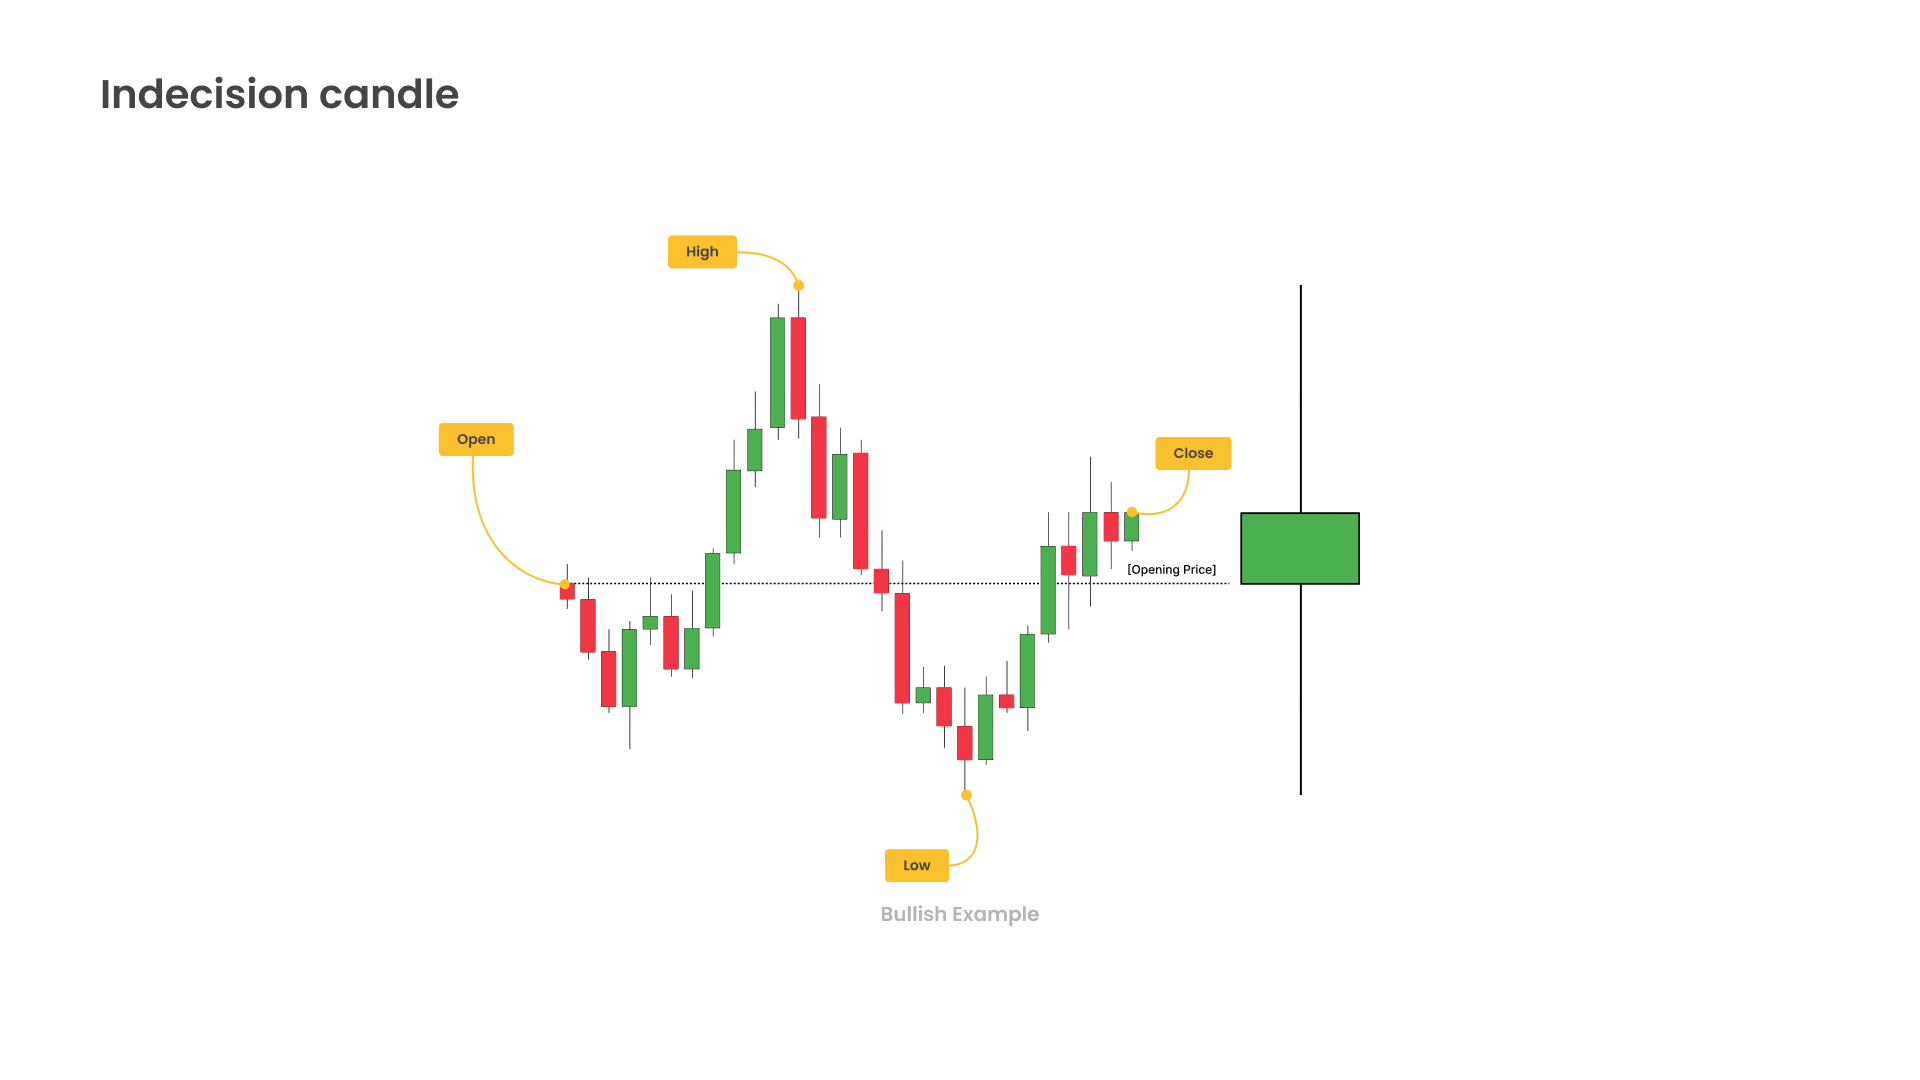
Indecision candles
Indecision candles form when the market can’t pick a direction.
- Price opens, makes a high and a low, but closes near the open.
- Long wicks on both sides with a relatively small body.
They often show up after big expansions or during low-volatility sessions. Think of them as a pause before the next push.
Tip: 💡
Although often avoided, indecision candles can be traded by trading a deviation from a range back to the opening price.
Why this matters
Recognizing these three types helps you frame trades:
- Directional candles favor continuation setups.
- Reversal candles warn of shifts in trend at relevant levels.
- Indecision candles suggest consolidation and should be avoided.
And remember: every higher-timeframe candle is built from smaller candles. Once you internalize OHLC, you can “see” the lower-timeframe path inside any bar.
Putting it into practice
When you study a chart, ask yourself what the previous candle did:
- Did this bar mostly move one way (directional)?
- Did it try one way and then flip (reversal)?
- Or did it lack direction (indecision)?
When you learn to identify the previous candle type, you can layer those reads with your bias and anticipate the next. Blend with the phases of price for extra confluence. Understanding OHLC is how candles stop feeling random and how you learn to anticipate the market.