TradingView – Chart Area Basics & Settings
In this article will setup the TradingView – Chart Area Basics & Settings for better viewing through exploring the setting and favorite the drawing tools, chart styles, use Watchlist and connect Trading Panel to paper trading for learning period.
Also whatever settings are set here are also used on this website chart images for all articles.
Table of Contents
First Look.
By Default it will be AAPL (Apple Stock) of NASDAQ Exchange with Daily Timeframe. If its not no worries will set it to something different for now so we can set up with no difficulties.
Setting the Chart.
Selecting a Stock and Saving the Layout.
So now do the following steps in your TradingView Browser tab.
- In the top Menu there is symbol search click on it and type in that search “SBIN”. After typing this you should see 3 Scripts select the one that says “State Bank of India” which has on the right side stock exchange name “NSE”.
- Next Click on the Timeframe button in the top panel and select “1 Day” if already set no need to change.
- In the top menu right side there is “Unnamed” clicking on it will save the chart. Whenever you want to save changes to the chart you want always to load when you open TradingView you must click here.
- After saving click on the arrow pointing down after “Unnamed” you will get a dropdown menu select Rename give whatever name you want for this chart layout. It will Replace Unnamed. So when you want to save next time click on the name you created.
- There is auto save but its risky cuz any unwanted changes might also get saved. If you are fine with that go ahead.
Setting up Trading Panel to Paper Trading.
- Click on “Trading Panel” in the bottom menu/panel.
- There will be a list of brokers in that hover on “Paper Trading” and you will see connect button click on it.
- There will be a pop up to connect with disclaimer mentioning
“Paper Trading (also known as simulated trading) lets you practice buying and selling securities. Technically it is same as real trading, but with no risk of losing money. Our system tracks your orders and you can see how much Profit or Loss you have on your account, and evaluate how good you are at trading!” - Clicking on connect will connect it to order window. You will see the account balance 1 Lakh.
And the Panel is populated with Position, Orders, History, Account History and Trading Journal. - It is highly recommended to set the account balance to whatever real money you will be introducing to the market later. You will learn later in the course & articles but until then let it be 1 Lakh.
- Clicking back on “Trading Panel” now named “Paper Trading” will minimize the panel.
Chart Area
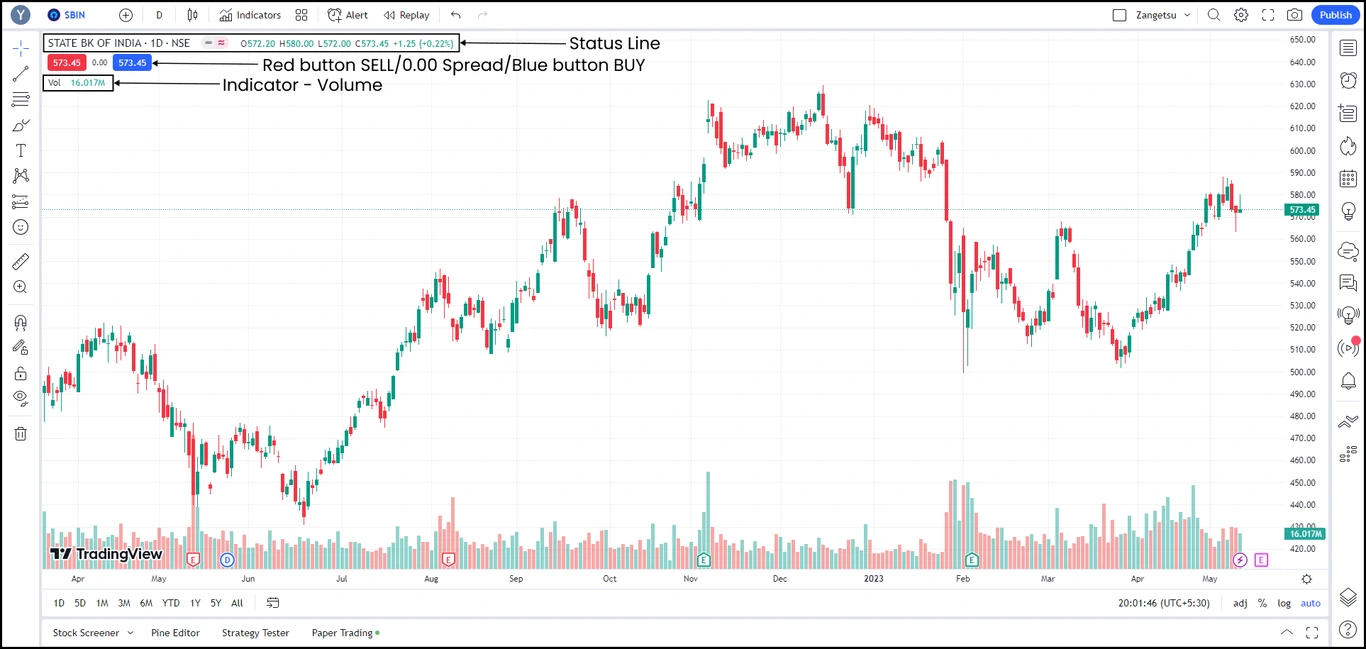
Status line
By now your chart should look like the above image. The Status line marked in the image shows that State Bank of India is the script selected with 1D tell us its Daily Chart and NSE is exchange. After NSE there is -≈ symbol. Clicking on it will reveal the following.

As you can see in the image it tells us that Market is closed and gives information on when it will open and close with pre and post market timings. But the main information is the second part “One update every 5 seconds” which is good for trading live. It would be bad if it was 15 min Update then we would have to get their Paid plan. So next time check this crucial information on any other script.
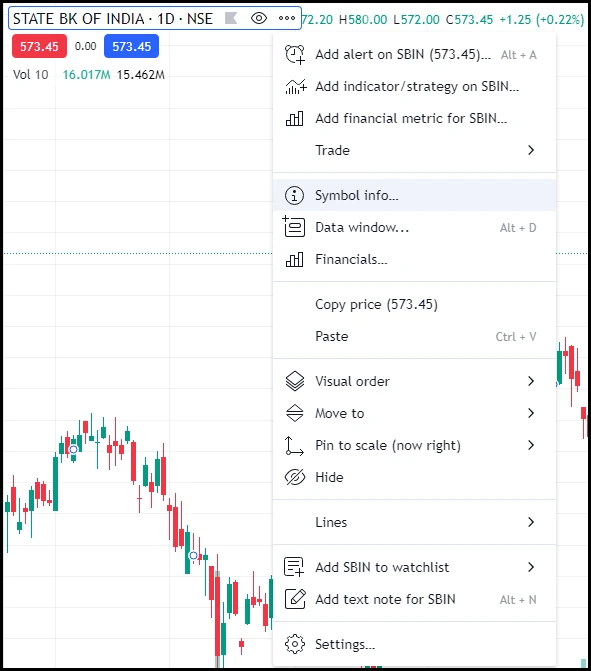
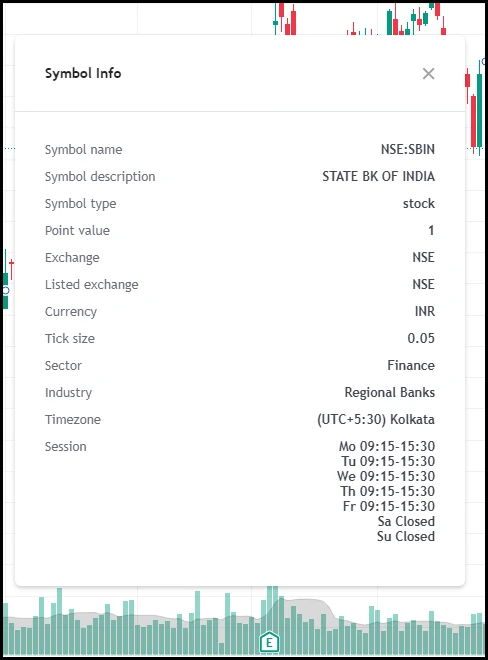
One more thing if you want to see the Symbol details then hover on Status line click on three dots a menu will appear as seen in above left image. Click on “Symbol Info” a dialog will appear with info regarding the symbol as shown in above right image.
You can get info like symbol name i.e. SBIN (short name to search this script in “search symbol“) description, type, Exchange, Tick Size
Buy/Sell buttons
Next is OHLC in status line i.e. self explanatory. Below the status line there are 2 buttons Red is SELL button and Blue is BUY button. In the middle of the button is Spread which is difference in ASK and BID. Spread formula is Bid – Ask. In the above example it is 0.00.
Indicator
The third one is the Indicator named Volume. This Volume indicator shows executed volume below every candle. The Volume bar at the bottom is red if the candle above it is bearish and green if the candle above is bullish. But this color scheme is not true as you will learn later that there are both parties involve buyers and sellers. There is no such thing as this candle has only buyers and this has only sellers.
So hover on volume indicator you will see settings gears icon click on it (From now on any time you want to change indicator settings you have to hover over that indicator name and change settings and save chart layout).
After settings window appear click on “style” and change the color of “growing” to any color you like give the same color to “falling“. Then tick the Volume MA, click on color and change the opacity to 15. Now click on the square icon on the right side of color and select “area” then go to the “inputs” tab left of the “style” change the “MA length” to 10 and click OK button. Save the chart so this indicator settings are saved.
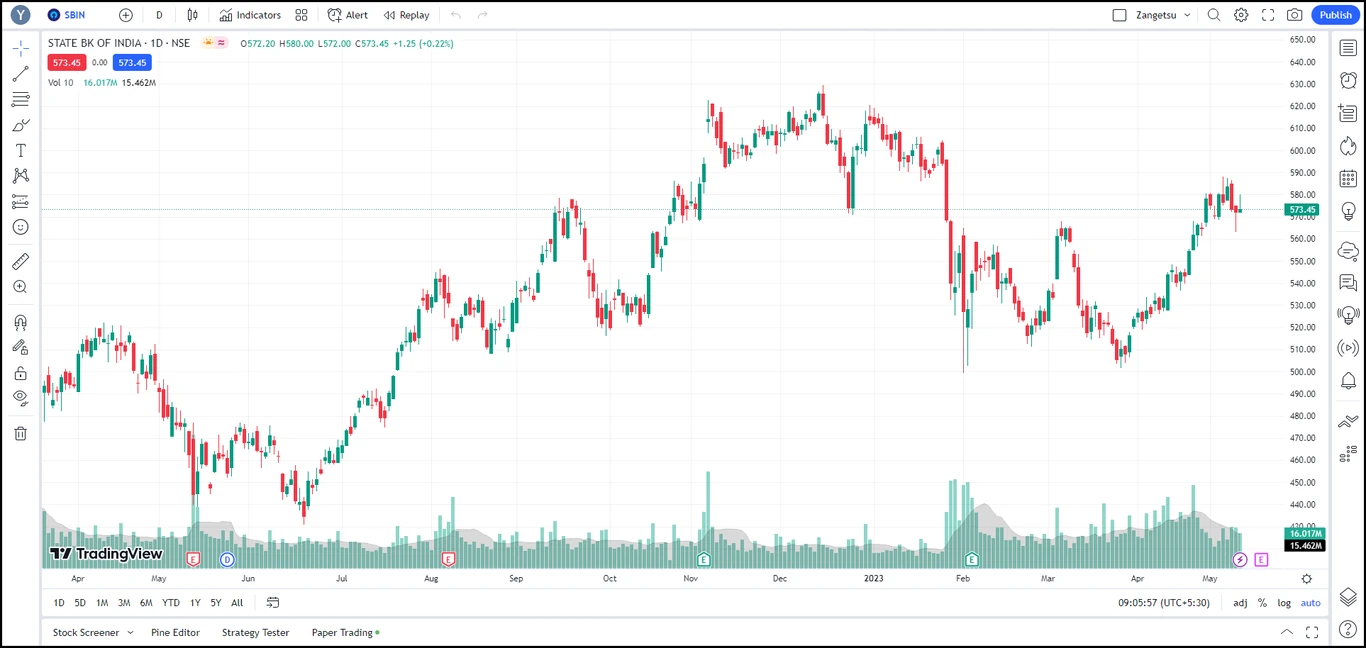
This is how your chart should look by now. Next will get into the Main Settings.
Settings
In the top menu on the right side after search icon there is settings with gear icon click on it. “Chart Settings” should pop up. On the left side you can first see “Symbol” highlighted and setting for symbol on right. For “Symbol” on right side change the wick to “Black color”.
Next click on “Status Line” in left side and for status line change the “Title” Description to “Ticker and description” and tick “Volume” on so that it may appear in the status line.
Nothing to change in “Scales“. Check if “Countdown to bar close” is ticked.
Next is “Appearance” change the grid lines to “None“. Change the Scales “Text” font which is 12 to anything your chart is readable and pleasing to eyes. Below “Text” there is “Lines” change the opacity from 0 to 15.
Now click on “Trading” and tick “Play sound for executions“. Above “Play sound for executions” is “Instant orders placement” which should be always off otherwise your orders go market order only.
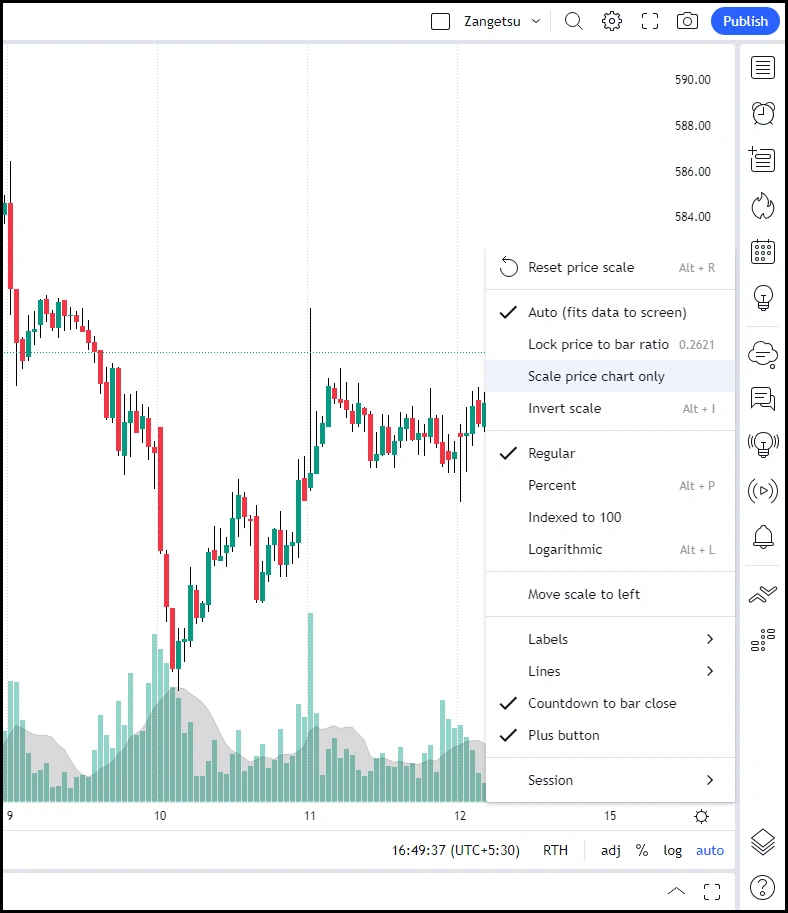
Nothing to change in “Events“. Click OK and save the chart layout. Now go to “Timeframe” in top menu and change it to 15 mins. As you should notice the 15 min chart which is intraday chart doesn’t show day (session) break i.e. when the day closes and next day starts. So again open the settings and click on “Events” there is a setting called “Session breaks” tick it ON and change the color grey next to the white color. Then click on the square box right to color and make it “Dotted Line“. Press OK and save the “chart Layout“. Now one last setting, go to bottom right corner there is settings gear below the price axis click on the gear and select “Scale price chart only“. See the image below if you don’t find the setting’s.
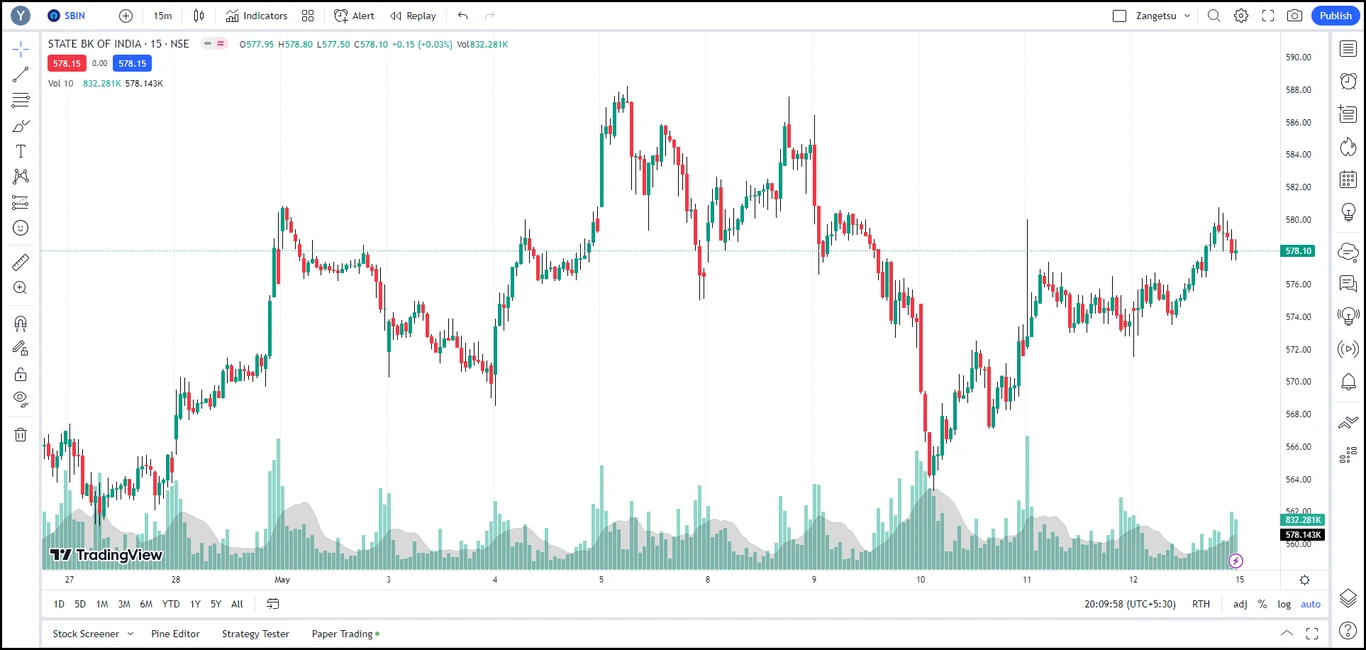
Now save the chart and it should look like the following image
In next article will see how to draw and mark favorite drawing tools to access fast. That’s it for this article.
